Market data you can trust.
No survey submissions. Just real-time employee data.
Benchmarks built to guide compensation reviews, equity planning, and pay decisions — all in one platform, backed by compensation experts at every step.
Defensible Benchmarks
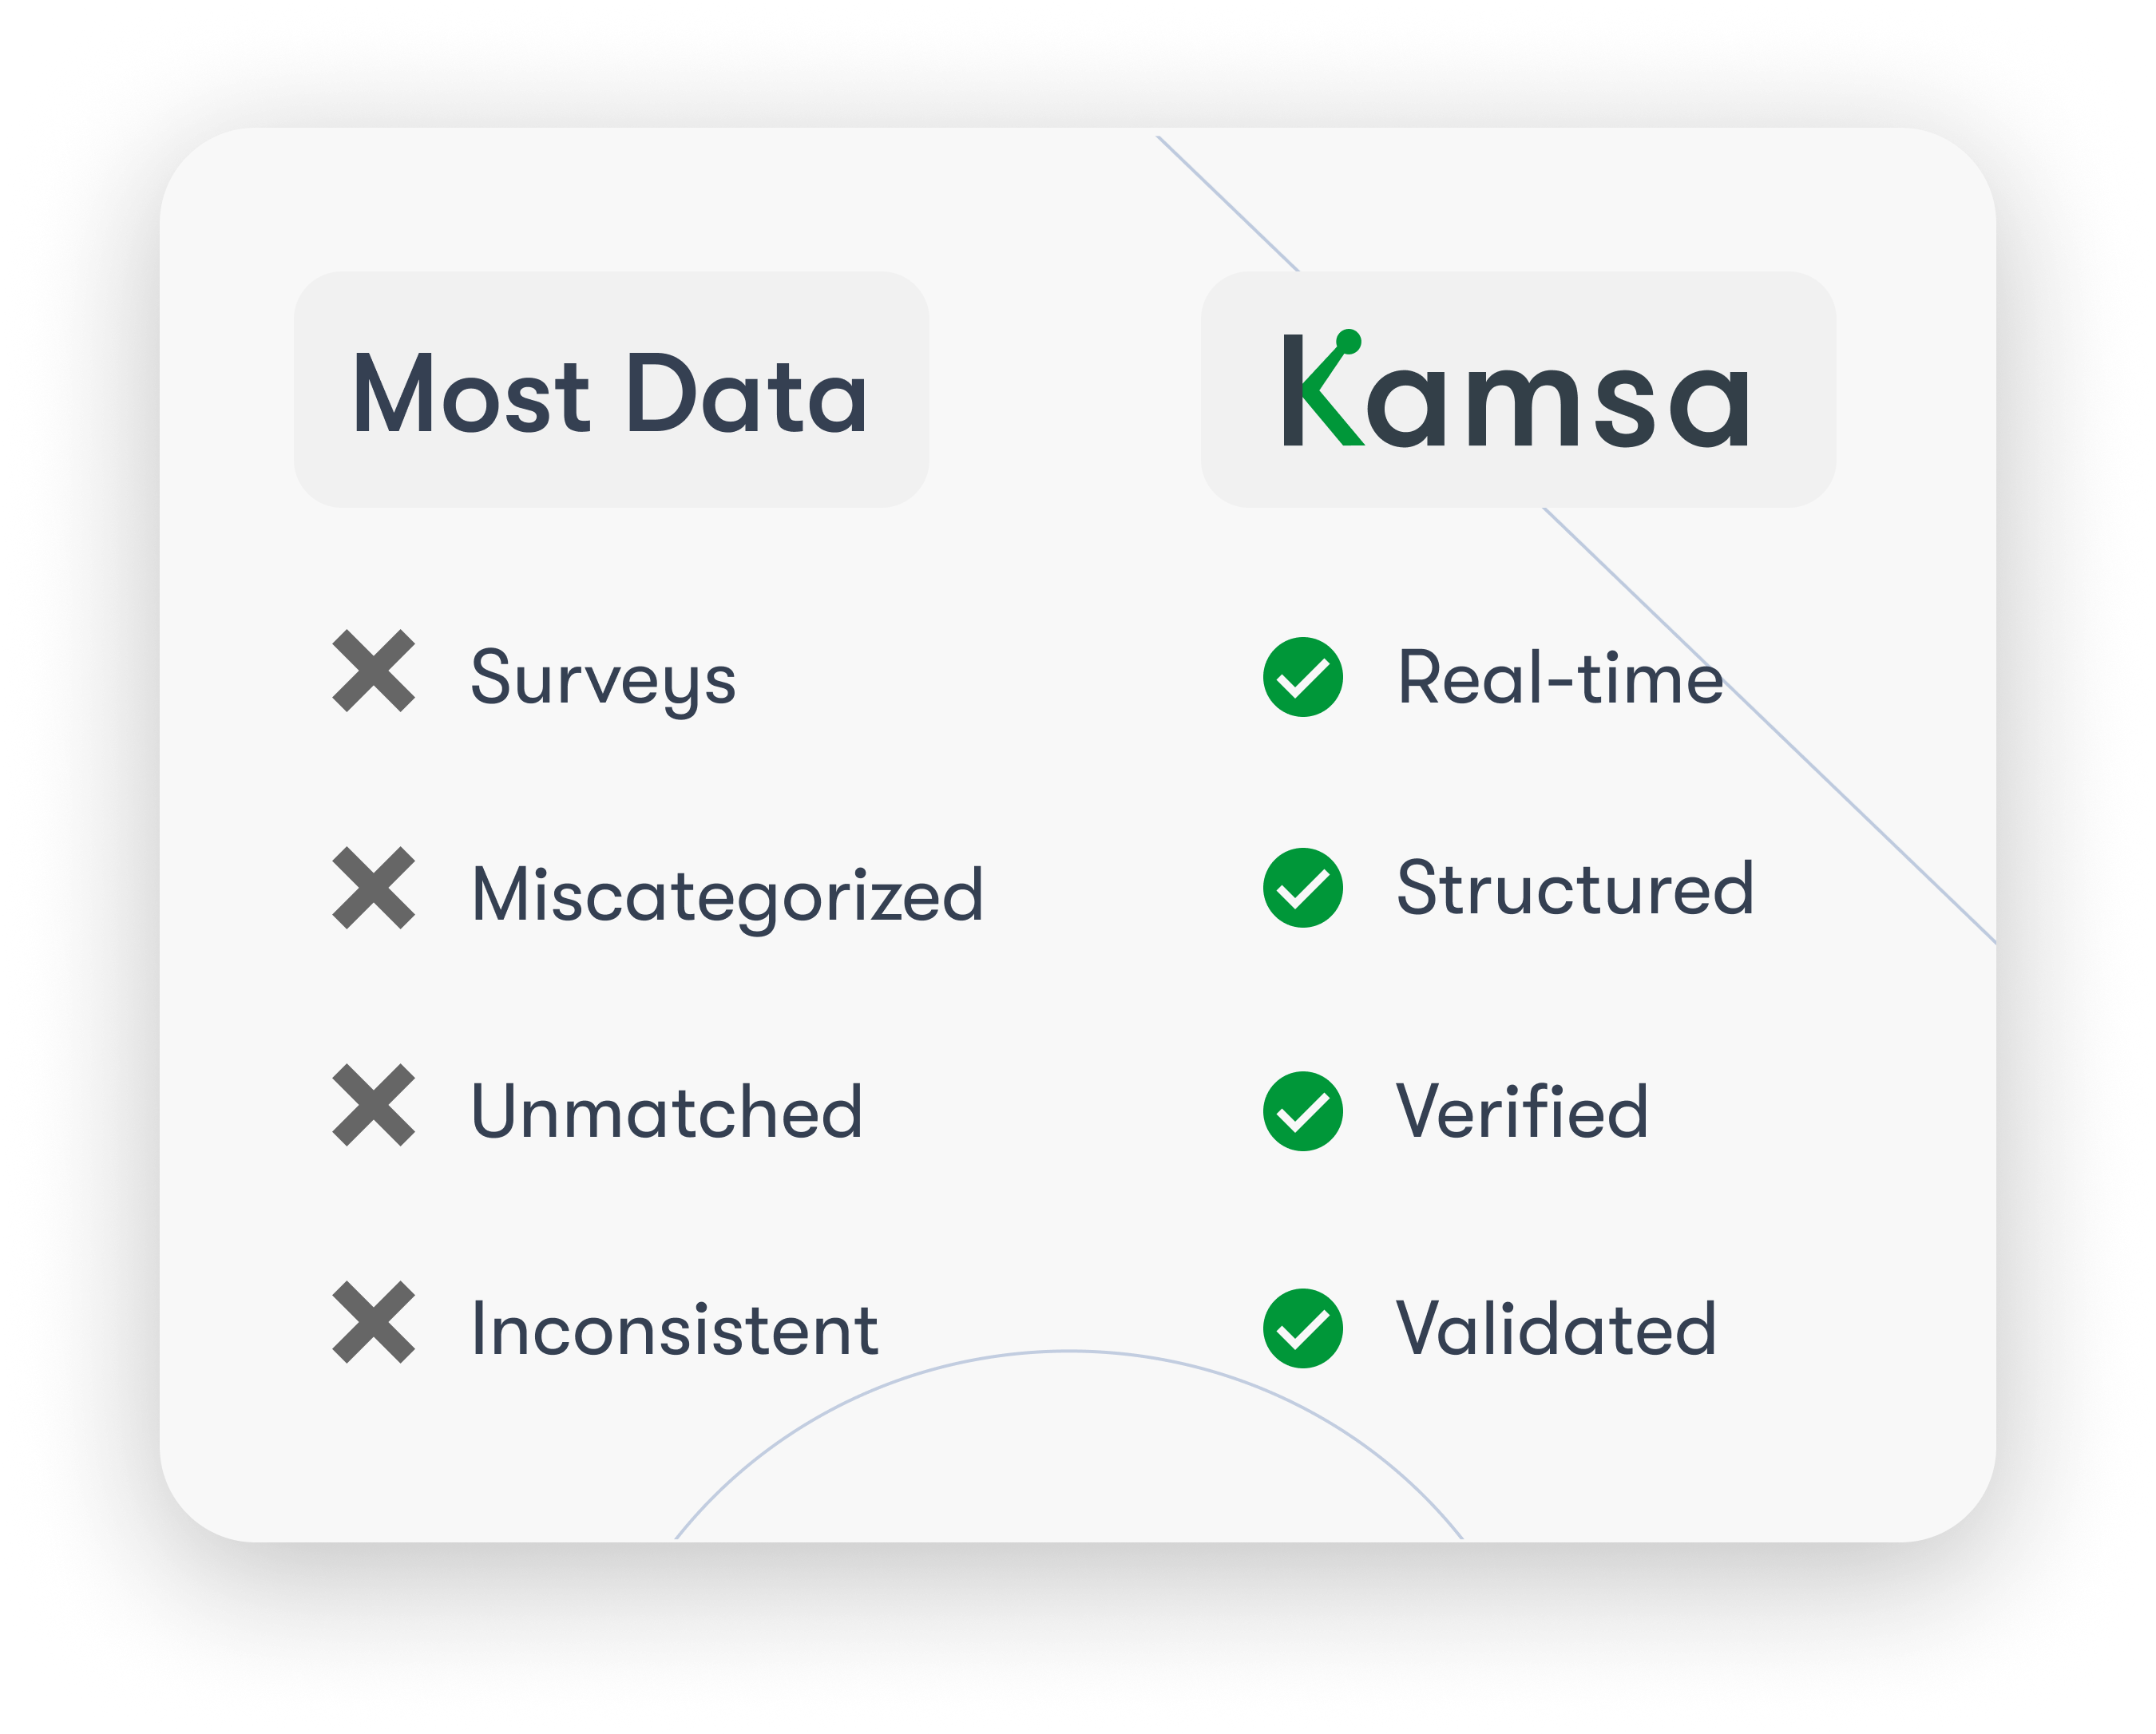
Data without structure is just bad data.
Most salary data relies on outdated surveys or inflated ranges — not what people actually earn.
Titles vary across companies and employee data is often miscategorized or left unverified.
Kamsa goes further — starting with anonymized employee records, structured through job architecture and validated by experts.
Start using benchmarks that hold up.

Real Employees. Real Pay.
Compensation data from real operating teams.
Kamsa’s benchmarks are built from anonymized employee records submitted directly by HR and People teams — reflecting how real companies pay across industries.
2,000+ roles across product, tech, operations, G&A, and more
Strong representation in tech-enabled sectors like manufacturing, health, real estate, and professional services
Most contributors have < 1,000 employees
Refreshed quarterly for cash, annually for equity
Includes salary, bonus, and equity by function, level, and location
Designed for companies where comp strategy matters — but dedicated resources are often limited.
From Raw Data to Reliable Benchmarks.
Kamsa turns raw data into benchmarks you can trust.
We don’t just clean data — we make it decision-ready. Every data point goes through a rigorous validation process:
Job leveling with your team: Align your roles to our market-friendly job architecture
Machine learning QA: Surface outliers and check for internal consistency (e.g., IC3 never exceeds IC4)
Human validation: Every role match is reviewed by our compensation experts
The result? Benchmarks that are accurate, structured, and actually usable.
All Your Data. One Place.
Data that’s already where you need it.
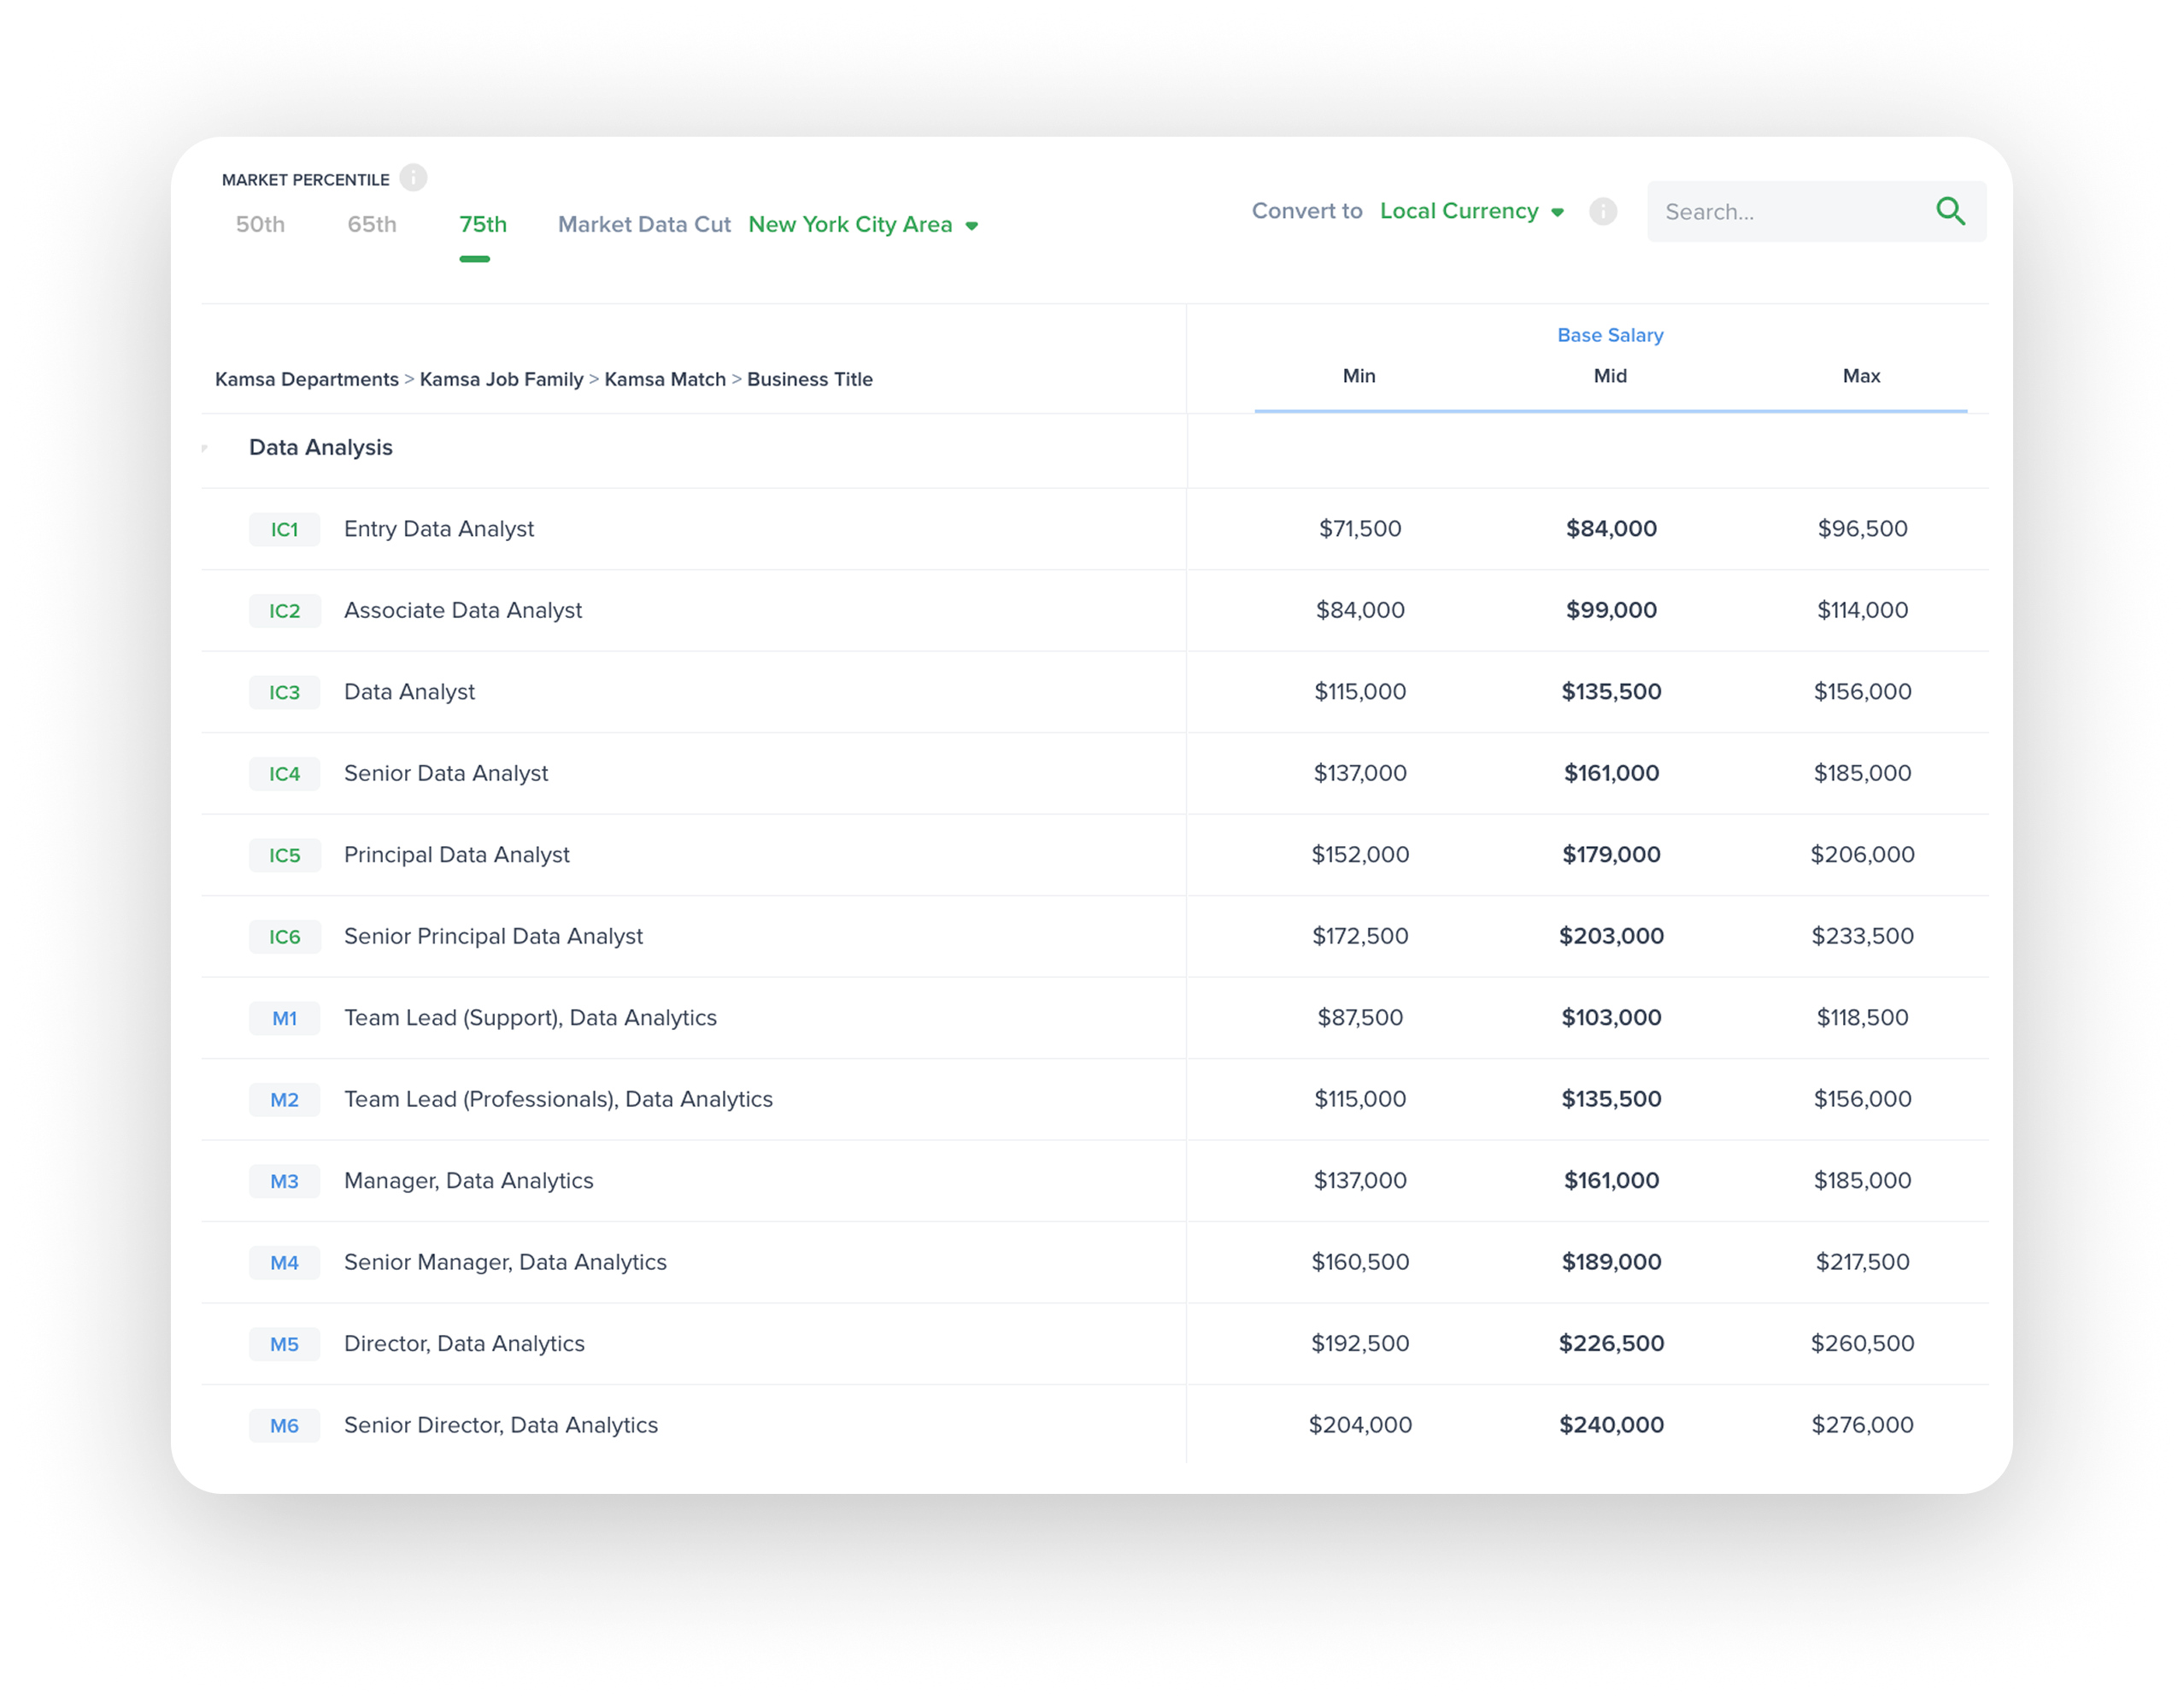
Kamsa’s market data isn’t buried in spreadsheets or PDFs. It’s built into the platform you use to run compensation reviews, model equity grants, and build pay ranges.
Build tailored salary and equity ranges
Run merit cycles and refresh grants
Spot pay gaps and leveling issues
Guide executive and board-level decisions
All within the Kamsa platform, with your comp consultant by your side.
Real Data, Real Support